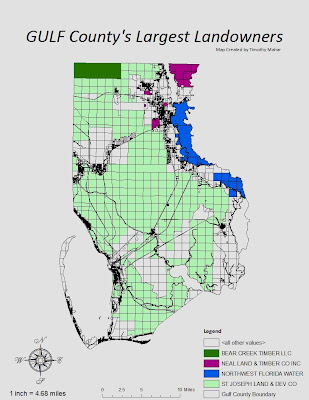
Easy lab which would have taken mere moments had the computer not chosen to perform random functions when i wasn't looking... fortunately i constantly resave because twice i had to shut down and come back into my saved map to continue. I would have preferred to rid the map of the gridded look but couldn't fand a way since the grid is part of the layer which shows the physical border as well. Placing the aceraga totals directly ON the map would have made sense but looked quite sloppy with the grid there as well, so i decided to skip them, trusting that the audience for this map would be able to tell easily enough that St Joe owns most of the county without needing a numner to confude the issue.
25 March 2010
17 March 2010
Potential Campsites week 9
Q1. I tried "intersect" but it left out large portions of the map area... predictably, so i then tried "Update" which gave me something much closer to what the directions to use "Union" had us all end up with.
Q2. I used the "Erase" tool because the purposes of none of the other made any sense for 'eliminating' the area in question. Erasae was the only option that made sense.
Q3. There were 79 features in this layer and (since we were instructed to find an area but not given a scale to use, i chose sq. miles) The largest area was 0.4127 square miles. The smallest area was 0.00012 square miles.
Subscribe to:
Comments (Atom)


